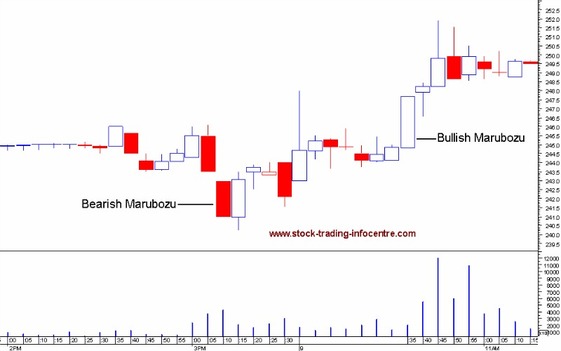
Marubozu
Marubozu candles do not have upper or lower wicks and the high and low are represented by the open or close. A White/Bullish Marubozu forms when the open equals the low and the close equals the high. This indicates that buyers are in complete control. Black Marubozu forms when the open equals the high and the close equals the low, and is very bearish. This indicates that sellers were in compete control of the price action. Look at the chart below: soon after the bearish marubozu, you have a long bullish candle that completely engulfs the body of the marubozu. Always wait for confirmation, and don't just rely on candles. Just because you see certain candles, doesn't mean its always going to go a certain direction. The intrinsic meaning of the candle is not changed; however, there are many factors in the market that can cause these technical irregularities. The other problem with the trade is the gap between the two long bearish candles, as most gaps tend to close. There weren't really any good entry points in this chart.
Marubozu
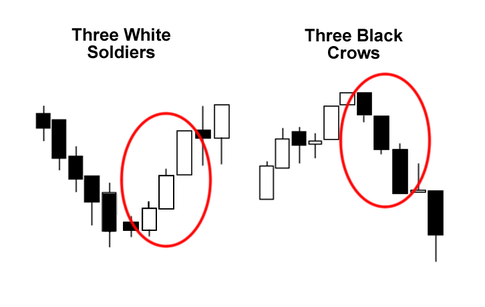
Three white soldiers. Three black crows.
Three white soldiers is a pattern that consists of three long body bullish candles. It's pretty obvious why this pattern is very bullish as the buyers were able to keep control for three straight sessions. Three black crows is a pattern that consists of three long body bearish candles, the sellers were in control for three straight sessions.
Three white soldiers. Three black crows.
More on candle sticks
Candle sticks that look the same can have different meaning, different price actions can technically give you the same type of candle stick. Look at the first picture for an illustration. The difference can become quite relevant in certain situations. One way to prevent this from happening is to look at the candle stick on shorter time frames as this tend to divide your candle sticks into smaller portions.
The opposite of this is to the blend candle sticks. Some analyst likes to do this. I personally don't like it because it dumbs down the information and doesn't take the sequence of the candles into account. Look at the second picture. In the first blending example, you see a bullish engulfing pattern. Now, switch the places of the two candles that makes up the hammer pattern and you get a bearish harami. As you may have seen in the other candle stick page, it has a very different meaning.
The opposite of this is to the blend candle sticks. Some analyst likes to do this. I personally don't like it because it dumbs down the information and doesn't take the sequence of the candles into account. Look at the second picture. In the first blending example, you see a bullish engulfing pattern. Now, switch the places of the two candles that makes up the hammer pattern and you get a bearish harami. As you may have seen in the other candle stick page, it has a very different meaning.
